
May 13, 2026 · BlueGPS Team
Addressing Delays and Bottlenecks in MRO Environments
MRO delays often come from small operational issues that build over time, not single failures. This article explains why tools, parts, work orders, and process bottlenecks cause delays and how MRO teams can improve throughput by finding and fixing the root causes.
Delays in MRO are expensive. When an aircraft is on the ground longer than planned, or a production line stalls waiting for a tool or part, the costs accumulate fast. Those costs include direct labour, missed schedules, and in downstream knock-on effects that can take days to absorb.
The frustrating thing is that most MRO delays aren’t caused by a single catastrophic failure. They’re caused by small inefficiencies stacking up: a technician spending 20 minutes tracking down a piece of equipment, a work order sitting idle because a component hasn’t arrived at the bay, a bottleneck in one process stage that nobody spotted until it had already delayed three work packages.
These are operational problems, and they have operational causes. Understanding where delays actually come from and what it takes to address them systematically is the starting point for improving MRO throughput.
Why MRO Delays Are Hard to Address
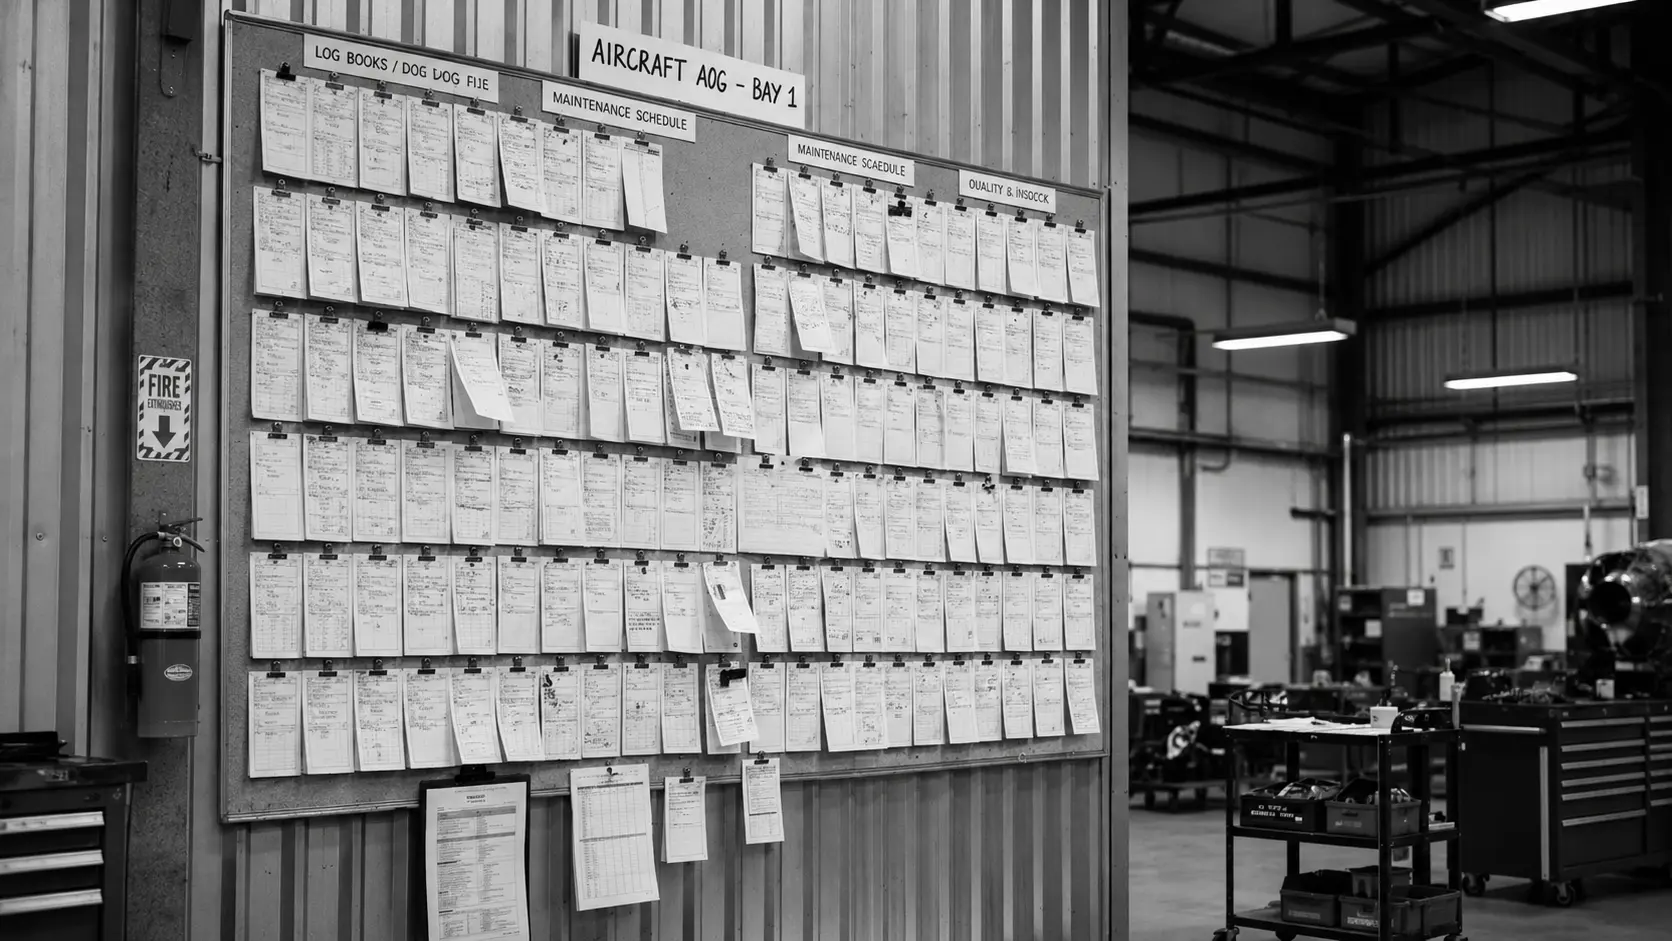
The core difficulty with MRO delays is visibility. Most facilities operate with a significant lag between what’s happening on the floor and what’s recorded in their systems.
Planning systems (whether that’s a CMMS, an ERP, or a dedicated MRO platform) are built around planned work. They reflect what should be happening: which technicians are assigned to which tasks, which tools and parts are allocated to which work orders, what the expected turnaround time is. What they can’t tell you is what’s actually happening right now.
When a work order falls behind, the signal tends to arrive late. A supervisor notices a bay that should have moved to the next stage hasn’t. A technician reports they’ve been waiting on a part. A shift ends and the progress doesn’t match what was expected. By the time the delay is visible in the system, it’s already embedded in the schedule.
This is the fundamental gap in most MRO operations: the absence of real-time execution data. Teams manage to plan, but they can’t manage to reality.
The Most Common Sources of MRO Delay
Before thinking about solutions, it’s worth being specific about where delays typically originate. They tend to cluster around a consistent set of causes.
Tool and Equipment Search Time
This is one of the most pervasive and underestimated sources of lost time in MRO. Studies and operational audits repeatedly find that technicians spend a significant portion of each shift searching for tools, trolleys, test equipment, or ground support equipment (GSE).
The problem is structural. Tools are shared across teams and shifts. There’s no reliable system for knowing where something is between the moment it was last used and the moment it’s needed next. Manual logs and check-out systems help at the margins, but they depend on compliance that’s hard to maintain consistently.
At a facility with 50 technicians each losing 20 minutes per shift to search time, that’s over 15,000 hours of lost productive time annually. The impact on throughput is direct and measurable.
Parts and Materials Not Ready at Point of Work
Maintenance tasks can’t start or have to stop when the required parts aren’t available at the right place at the right time. This is distinct from parts being out of stock. More often, the issue is that parts exist in the facility but aren’t where they need to be: stuck in stores, mislaid in transit between stores and the bay, or held up in a kitting process that hasn’t completed.
In aircraft MRO specifically, this is a significant driver of aircraft-on-ground (AOG) time. The work is ready to proceed, the technicians are available, but the task is blocked waiting on material that should already be there.
Bottlenecks Between Process Stages
MRO work moves through a sequence of stages — inspection, disassembly, repair, reassembly, testing, quality sign-off. When one stage is slower than the others, work-in-progress (WIP) accumulates in front of it. That’s a bottleneck.
The problem with bottlenecks is not just the delay they cause at that stage — it’s the cascading effect on everything upstream and downstream. Work backed up waiting for quality inspection can’t move to final checks. Work in final checks can’t be released. The aircraft can’t return to service.
In most MRO environments, bottlenecks aren’t invisible. Experienced supervisors usually have a sense of where they form. The problem is that identifying them consistently, measuring their impact, and proving that an intervention has made a difference is very difficult without data.
Workforce Coordination Gaps
Effective MRO requires the right people, with the right skills and certifications, to be in the right place at the right time — alongside the right tools and materials. When that coordination breaks down, tasks are delayed not because resources are unavailable but because they’re not aligned.
A technician with the required certification arrives at a bay to find the required tooling hasn’t been returned from the previous shift. A work zone needs two certified technicians present simultaneously for a sign-off, but one is occupied elsewhere with no visibility to the supervisor. These are coordination failures, and they happen constantly in facilities that lack real-time situational awareness.
Unplanned Maintenance and Reactive Management
When visibility is low, management becomes reactive. Supervisors spend time chasing status updates rather than managing proactively. Issues that could be addressed early (a task running behind, a resource about to become unavailable) only surface when they’ve already become problems.
This reactive mode is self-reinforcing. Time spent fire-fighting is time not spent on planning and prevention. Facilities get locked into a cycle where delays generate more delays.
What It Takes to Reduce MRO Delays Systematically
Addressing delays requires changing the data environment that operations teams work with. Specifically, it requires moving from event-based and manual data to continuous, real-time data about what’s happening on the floor.
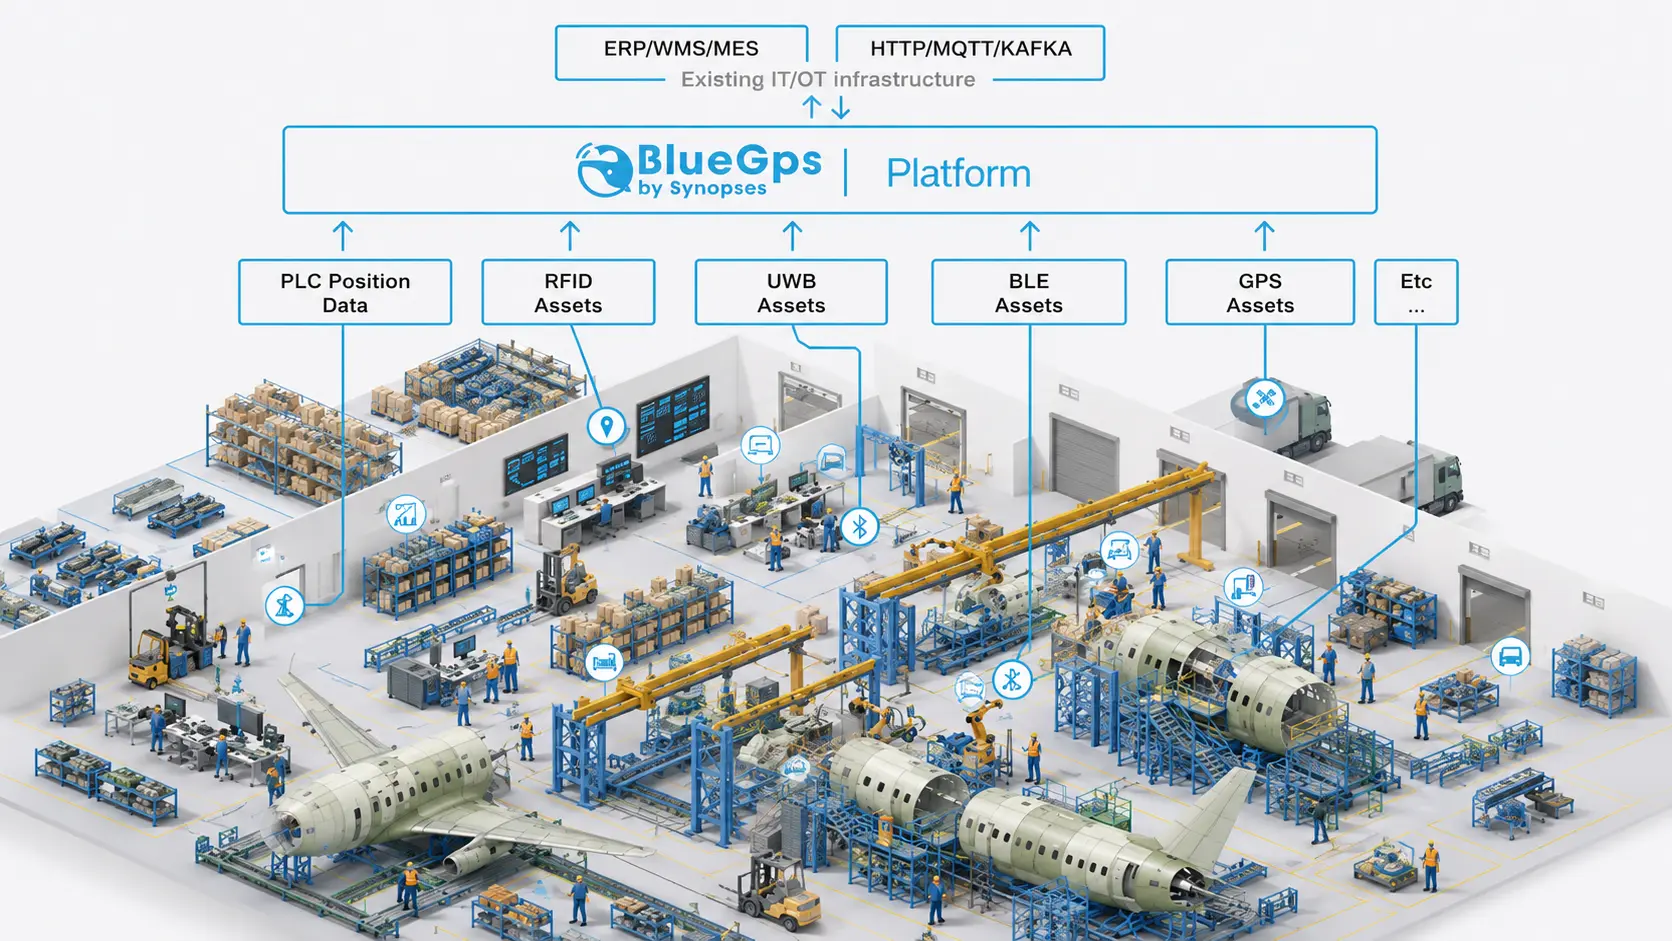
Real-Time Asset Location
The most direct intervention for tool and equipment search time is continuous location tracking. When every tagged tool, trolley, and piece of GSE has a known location that updates in real time, search time drops sharply. Technicians can find what they need without walking the facility. Supervisors can see at a glance which assets are in which zones, which have been stationary too long, and which are due for return.
This also changes the dynamic around loss and shrinkage. Assets don’t quietly disappear — their last known location is always recorded. Over time, this tends to drive improvements in how assets are managed between shifts.
Parts and Material Flow Visibility
Tracking materials from stores through kitting to the point of use gives operations teams visibility of where parts are in the flow and whether they’ll be ready when needed. When a task is scheduled to start in four hours and the required components haven’t left stores yet, that’s a signal that can be acted on now rather than discovered at the point of delay.
This kind of visibility is particularly valuable for time- or condition-sensitive materials like items with expiration dates or restricted environmental exposure times. Knowing how long a material has been outside controlled storage is operationally significant and, in regulated environments, a compliance requirement.
WIP Monitoring and Bottleneck Detection
When work order progress is tracked through actual asset and technician location (rather than manual status updates) bottlenecks become visible as they form. A work zone where assets are accumulating, where dwell times are extending beyond expected ranges, or where the sequence of process steps is stalling can be identified in real time.
This matters for two reasons. First, it allows supervisors to intervene while there’s still time to limit the impact by reallocating resources, adjusting priorities, or addressing the underlying cause before it affects the schedule. Second, over time, the data builds a picture of where structural bottlenecks exist in the operation, informing decisions about process design, capacity, and resource allocation.
Workforce Coordination Through Situational Awareness
Real-time location of technicians combined with zone-based rules about who needs to be where for specific tasks gives supervisors the situational awareness to coordinate effectively. They can see which personnel are in which zones, whether co-location requirements for a task are met, and where people are available to be redeployed.
This also supports safety. In aviation MRO, controlled zones around active aircraft and high-risk equipment need to be managed carefully. Knowing who is present in a zone, and whether they have the right certifications for the work being performed there, is both an operational and a compliance requirement.
Closing the Loop with Systems Integration
Location data becomes most powerful when it’s integrated with the systems that manage work — CMMS, EAM, ERP. When a component arrives at a maintenance bay, the work order can update automatically. When a tool enters a calibration zone, the maintenance record reflects it. When a technician’s dwell time in a work zone confirms a task has been completed, the next task can be triggered.
This kind of closed-loop workflow reduces the administrative burden on technicians and supervisors, and ensures that the data in planning systems reflects operational reality rather than lagging behind it.
Measuring the Impact
Any intervention designed to reduce MRO delays needs to be measured. Without baseline data and post-implementation tracking, the improvement is anecdotal.
The metrics that matter most in this context are:
- Tool search time per technician per shift — a direct measure of the efficiency impact of location tracking
- WIP aging by process stage — identifies where work is accumulating and for how long
- Turnaround time by work package type — the headline measure of overall MRO throughput
- Task start delays — how often tasks begin late, and what the primary cause is
- Equipment utilisation rates — whether shared assets are being used effectively across shifts
- Schedule adherence — the percentage of work orders completed within their planned window
These metrics are not new. Most MRO operations already track some version of them. The challenge is that, without real-time data, they’re typically calculated retrospectively from imperfect records. The shift to real-time data doesn’t just improve operations; it improves the quality of the measurement itself.
The Compounding Effect of Small Improvements
It’s worth returning to the point about how MRO delays accumulate. Those small inefficiencies stacking up across many tasks and many people works in reverse when those inefficiencies are reduced.
Cutting 15 minutes of search time per technician per shift doesn’t just save 15 minutes. It means a task starts earlier, which means it completes earlier, which means a bay is available sooner for the next aircraft. And those efficiencies are occurring across every shift. Better material flow doesn’t just reduce one stalled process, it often removes a delay that was recurring across multiple work packages.
In MRO, throughput improvements tend to be multiplicative rather than additive. That’s why relatively modest improvements in operational visibility (in knowing where things are and what’s actually happening) can have a disproportionate impact on the metrics that ultimately matter: aircraft back in service on time, maintenance schedules met, and costs controlled.